
2020必考雅思数据类图表一网打尽!
2020-01-08 环球教育
事情是这样的。众所周知,小作文考试是以数据类图表为主的。而在五种数据类图表里面,柱状图常年以来都是一枝独秀。纵观历史数据,每年柱状图都会考到二十个上下。刚刚过去的2019年,柱状图更是全年发力,和考生们见面二十四次。正所谓得柱状图者得天下也。
其实,柱状图大体上分类三类,这三类都掌握了的话,那么数据型图表就全在掌控之中了。
Part 1长线图
看这个名字大家不要误会。原本是讲解柱状图,怎么突然开始扯到线图了呢?其实,很多柱状图本身就是线图,而且是几条长线。例如下图:

定睛观瞧,不难发现,这就是三线图。而且所有的写作框架、模式与线图写法几乎相同。大家只要认真参考下面的考官例文自然可以掌握其中奥秘。
(An example of a very good answer from C9 T2)
The chart shows the time spent by UK residents on different types of telephone calls between 1995 and 2002.
Local fixed line calls were the highest throughout the period, rising from 72 billion minutes in 1995 to just under 90 billion in 1998. After peaking at 90 billion the following year, these calls had fallen back to the 1995 figure by 2002.
National and international fixed line calls grew steadily from 38 billion to 61 billion at the end of the period in question, though the growth slowed over the last two years.
There was a dramatic increase in mobile calls from 2 billion to 46 billion minutes. This rise was particularly noticeable between 1999 and 2002, during which time the use of mobile phone tripled.
To sum up, although local fixed line calls were still the most popular in 2002, the gap between the three categories had narrowed considerably over the second half of the period in question.
如此一来,在考场中各位如果遇到线图也可以迎刃而解了。
Part 2短线图
怎么还是线图?其实动态图都大同小异,全部都可以被看作是线图,动态的柱图自然也是如此。与长线不同,短线的写法会有一点自己的特色,大家可以参考下图:
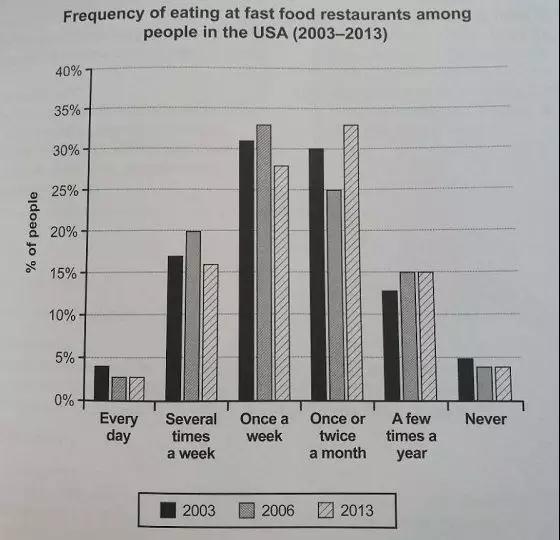
本题的数据看起来很是凌乱,但是可以将其分为六类(根据不同频率)。这六类数据都是2003, 2006和2013年的数据,所以每一类可以被看作为一个短的折线。如此一来,本题就是六条短的折线构成的动态图。了解这其中原理之后,大家只需要参考下面例文即可。
It is illustrated by this bar chart how the percentage of people with different frequencies of eating in fast food restaurants had changed from 2003 to 2013 in the USA.
The percentage of people who ate there once a week amounted to 31% in 2003, and then increased to 33% in 2006, but underwent a decline hitting at 28% in 2013. The figure for people who ate there several times a week experienced the similar trend from 17% in 2003, to 20% in 2006 and 16% in 2013.
The proportion of people who went there once or twice a month took up 30% in 2003, and encountered a decrease to 25% in 2006 followed by a notice growth to 33% in 2013. Around 14% of people in 2003 went to fast food restaurants only a few times a year, and the proportion of them ascended to 15% in 2006, but then maintained at the same level at 15% in 2013.
People who never went there or every day had their meals there occupied 5% and 4% respectively in 2003, and thereafter figures for both of them descended to 4% and 3% in 2006. After 2006, they both remained the same.
On the whole, in these three comparative years over 50% of people ate there once, twice or even four times a week, whereas people who ate there every day or never amounted to less than 10%.
掌握了此图的写法,其实很多动态的表格和饼图也都可以按图索骥地完成了。例如C8T2的动态三饼图,其实也就是五条短线,写法和上文一样。而C6T2和C10T2的动态表格也都是由若干短线构成,那么写起来自然还是一样的配方一样的味道了。
Part 3静态的图
柱状图能屈能伸,可静可动。前面我们见识了两种动态的柱状图,下面一起来揭面一个静态的柱状图写法。以C10T3题目为例。
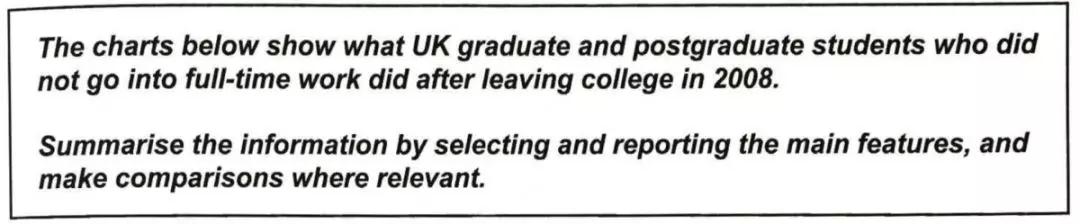
本题是典型的静态图,数据明显分为两类。逐类书写,莫忘对比,就是写这种静态图的关键了。其实考场中各种静态图的写法都是如此。例如,静态表格C7T1,与此题不同之处只是它的数据分类三类而已。同时,静态饼图C11T1也是一个数据分类三类的题目。写起来只不过是比上图多一个主段而已,其他无异。下面例文供各位参考:
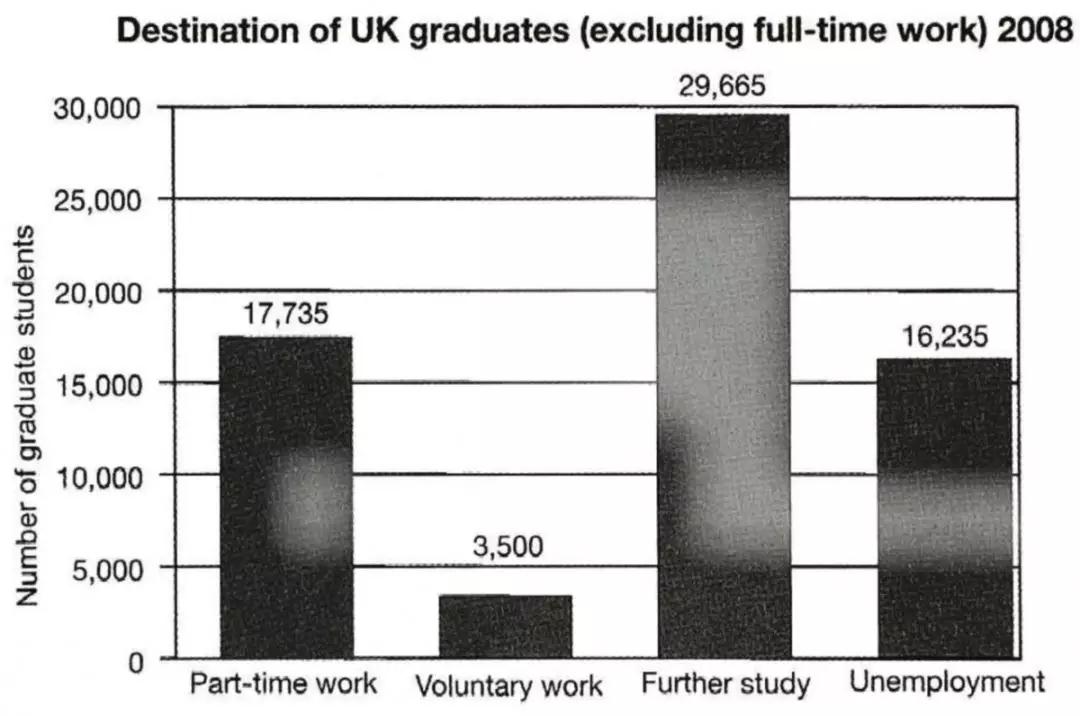
Four options that graduates and postgraduates without full-time jobs in the UK in 2008 would choose are illustrated by these two bar charts.
In terms of graduates without full-time employment, the majority of them (29,625) would like to further their study, and nearly the same amount of them chose part-time work (17,735) or to be unemployed (16,235), with 1,500 more choosing to work part time. Besides, voluntary work was the least popular choice, as only 3,500 of them selected it.
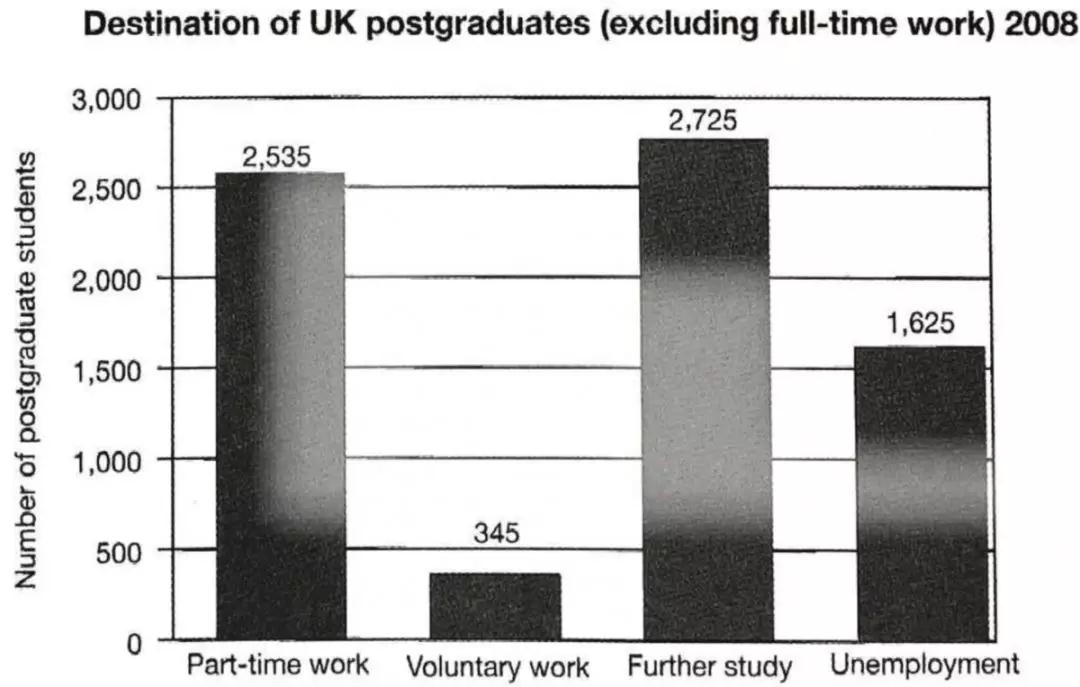
More interestingly, to further their study was also the most welcomed destination for postgraduates who did not get a full time job, with 2,725 of them pursuing it, followed by the second most prevalent choice part-time work chosen by 2,535. Meanwhile, 1,625 of them suffered from unemployment, and only 345 of them thought what they would like to do was voluntary work.
In summary, for those graduates and postgraduates, doing further study was the option attracting most of them, whereas doing voluntary work was the least popular choice.
Part 4莫慌!

考场中见了一些略显诡异的柱图,各位莫慌。以上题为例。这也是柱图,色彩斑斓,标新立异,柱图其外,线图其中。仔细一看,还是动态的柱图,那么写起来自然还是五条短线而已。总言之,只要大家掌握了上面三个柱图分类的写法,在考场中再见到任何数据类图表都将易如反掌,如履平地。
环球教育秉持教育成就未来的理念,专注于为中国学子提供优质的出国语言培训及配套服务。环球教育在教学中采用“九步闭环法”,帮助学生快速提能学习效能,同时提供优质的课后服务,跟进学生学习进程,为优质教学提供坚强的保障。目前,环球教育北京学校已构建了包含语言培训、出国咨询、国际课程、游学考察、课程等在内的一站式服务教育生态圈。相关问题可免费咨询,或拨打免费热线400-616-8800~~


北京市海淀区环球雅思培训学校 版权所有 课程咨询热线:400-616-8800
Copyright 1997 – 2026 gedu.org. All Rights Reserved 京ICP备10036718号
全部课程、服务及教材面向18岁以上人群
市场合作申请


 雅思资讯
雅思资讯 机经下载
机经下载 考题预测
考题预测 雅思听力
雅思听力 雅思写作
雅思写作 雅思阅读
雅思阅读 雅思口语
雅思口语 当前位置:
当前位置:


 400-616-8800
 免费咨询
免费咨询